Creating a tooltip for a line chart can be a great way to add interactivity and provide additional information to your data visualization. In this blog post, I will show you how to create a tooltip for a line chart using D3 and React.
Step 1: Set up the line chart
The first step is to set up the line chart. You can use any charting library to create your line chart. You can read my post visualizing data with line chart and generate the line chart.
Step 2: Create the tooltip
The next step is to create the tooltip. We can use third party libraries such as react-tooltip, yet again where will be the fun of it?! All jokes aside, our goal here is to learn how to create our own custom tooltip for our visualizations. Nevertheless, in future we will use some existing libraries. You can create a new div element for the tooltip and give it an initial position, such as display: 'none', to hide it initially. You can then use React state to keep track of whether or not the tooltip should be displayed.
Our tooltip needs some basic CSS properties like initial positioning, background color, etc. I create a styles.css file and defined the following properties:
#wrapper {
  position: relative;
}
tooltip {
  opacity: 1;
  position: absolute;
  top: 0;
  left: 0;
  padding: 0.3em 1em;
  background: #fff;
  text-align: center;
  border: 1px solid #ddd;
  z-index: 10;
  transition: all 0.2s ease-out;
  /* Prevent tooltip from receiving the mouse events we will be implementing */
  pointer-events: none;
}

/* Adds an arrow pointing down at the hovered bar */
.tooltip:before {
  content: '';
  position: absolute;
  bottom: 0;
  left: 50%;
  width: 12px;
  height: 12px;
  background: white;
  border: 1px solid #ddd;
  border-top-color: transparent;
  border-left-color: transparent;
  transform: translate(-50%, 50%) rotate(45deg);
  transform-origin: center center;
  z-index: 10;
}
In order for our toolip to work properly, it must have an absolute position (position: absolute) and its parent container (div with id of wrapper) needs to have a relative position (position: relative). .tooltip:before pseudo-selector will add an arrow pointing down at the hovered point. Also pointer-events: none prevents the tootip from stealing to mouse events as we'll add the events to our line and not the tooltip. The snippet below partially shows the linechart.js along with our tooltip component:
<div id="wrapper">
  <svg width={width} height={height} style={{ backgroundColor: '#F5F3F2' }}>
    // line chart code
  </svg>
  <div className="tooltip">
    <div>Date:</div>
    <div>Price:</div>
  </div>
</div>
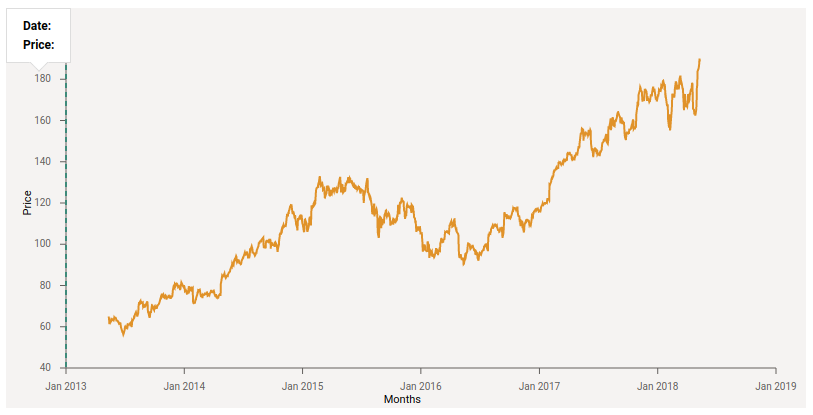
Toolitp is positioned in the top left of our wrapper div.

Step 3: Add event listeners
To make the tooltip interactive, you need to add event listeners to the line chart. You can use the onMouseMove and onMouseLeave events to detect when the user hovers over the line chart. However, instead of catching hover events for individual points of the line chart, we want to show a tooltip whenever a user is hovering anywhere on the chart. Therefore, we need to cover the entire bounding box of the line chart. To make that happen, we have to create a <rect> that spans our bounding box and add mouse event listeners to it.
<rect
  width={boundedDimensions.width}
  height={boundedDimensions.height}
  fill="transparent"
  onMouseMove={(e) => handleMouseMove(e)}
  onMouseLeave={handleMouseLeave}
/>
Please note that we don't need to specify the x and y attributes since they both default to 0. Also we have to set <rect>'s fill property to transparent, otherwise we will see a black rectangle covering the whole chart.
Step 4: Show the tooltip
When the user hovers anywhere over the line chart, we can use React state to update the position and visibility of the tooltip.
// Tooltip data
const [tooltipData, setTooltipData] = useState({});

// Flag to control whether to show or hide tooltip
const [showTooltip, setShowTooltip] = useState(false);

// x, y postion of closest point for drawing a circle
// around the point on the chart
const [xPos, setXPos] = useState(0);
const [yPos, setYPos] = useState(0);
Although we can use the event.clientX and event.clientY properties to get the current mouse position directly, we'd rather use d3.pointer() to transform the event position to the local coordinate system of the element that received the event. And use that position to set the tooltip's position.
const handleMouseMove = (e) => {
  const mouseXYPos = d3.pointer(e);
  console.log(mouseXYPos);
};

// Example of mouse position as an [x, y] array in
// the console output while moving the mouse
[689, 284];
Step 5: Add the data to the tooltip
When the user hovers over the line chart, we can use the data associated with that point to update the tooltip. We can use the d3.bisector() function to find the closest point on the line chart to the current mouse position and then use the data associated with that point to update the tooltip. To find the closes point, we can use the x position of the mouseXYPos point. Then using our xScale.invert() function, we convert from range (i.e. pixels) to the domain (i.e. dates in our dataset).
const xPos = mouseXYPos[0];
const hoveredDate = xScale.invert(xPos);
Next, we have to find the closest data point, i.e. the data point with the closest date, in our dataset that this hoveredDate. We can define a function that computes the distance via some comparator between two adjacent items. We run that for all the items in the dataset, and find the index of the item with least distance. However, d3 comes to save us by providing these many utility functions including one for this purpose. d3.bisector(accessor/comparator) returns a new bisector using the specified accessor or comparator function. In other words, it returns the insertion point for x in array to maintain sorted order. If x is already present in array, the insertion point will be before (to the left of) or after (to the right) any existing entries depending on if we choose bisectLeft or bisectRight.
const bisectDate = d3.bisector((d) => xAccessor(d)).right;
const closestIndex = bisectDate(data, hoveredDate);
We have the index of the closest point, so we can easily
- retrieve the corresponding data item
- calculate the position of the tooltip to be displayed
- update the tooltip data and React state
const closestDataPoint = data[closestIndex];
const closestXValue = xAccessor(closestDataPoint);
const closestYValue = yAccessor(closestDataPoint);
const newTooltipData = {
  data: closestDataPoint,
  x: xScale(closestXValue) + dimensions.margin.left,
  y: yScale(closestYValue),
};
setTooltipData(newTooltipData);
setShowTooltip(true);
setXPos(() => xScale(closestXValue));
setYPos(() => yScale(closestYValue));
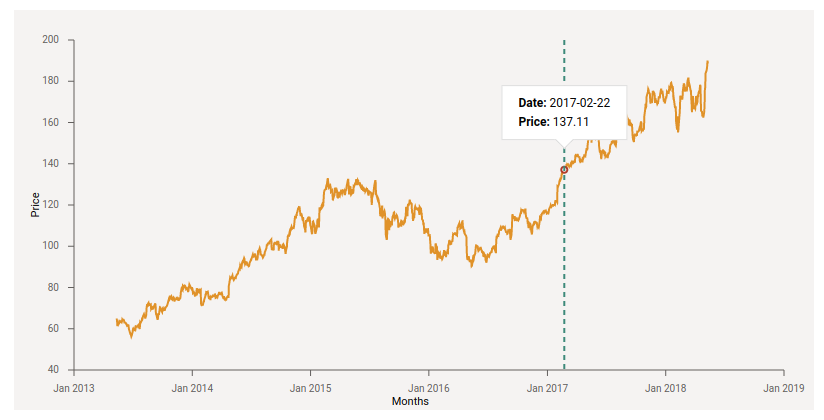
In addition to the tooltip, I added a vertical line <line>, and a <circle> to make the toolip more readable.
  <circle
    cx={xPos}
    cy={yPos}
    r="3"
    fill="white"
    stroke="#BD2D28"
    strokeWidth="2"
    pointerEvents="none"
  />
  <line
    x1={xPos}
    y1={0}
    x2={xPos}
    y2={boundedDimensions.height}
    stroke="#0F8C79"
    strokeWidth="2"
    strokeDasharray="5,4"
    pointerEvents="none"
  />

Step 6: Add styling
We can use CSS to style the tooltip and make it look more attractive. I simply added a few CSS properties in the styles.css to make the tooltip slightly more appealing.
.tooltip-info {
  font-size: 12px;
  text-align: left;
}
.tooltip p {
  margin-top: 5px;
  margin-bottom: 5px;
}
Additionally, I refactored the code a bit and created a separate component for the tooltip.
const Tooltip = ({ tooltipData }) => {
  const { data } = tooltipData;
  return (
    <div
      className="tooltip"
      style={{
        transform: `translate(calc(-50% + ${tooltipData.x}px), calc(-100% + ${tooltipData.y}px))`,
      }}
    >
      <div className="tooltip-info">
        <p>
          <strong>Date: </strong>
          {data.Date}
        </p>
        <p>
          <strong>Price: </strong> {Number.parseFloat(data.Close).toFixed(2)}
        </p>
      </div>
    </div>
  );
};
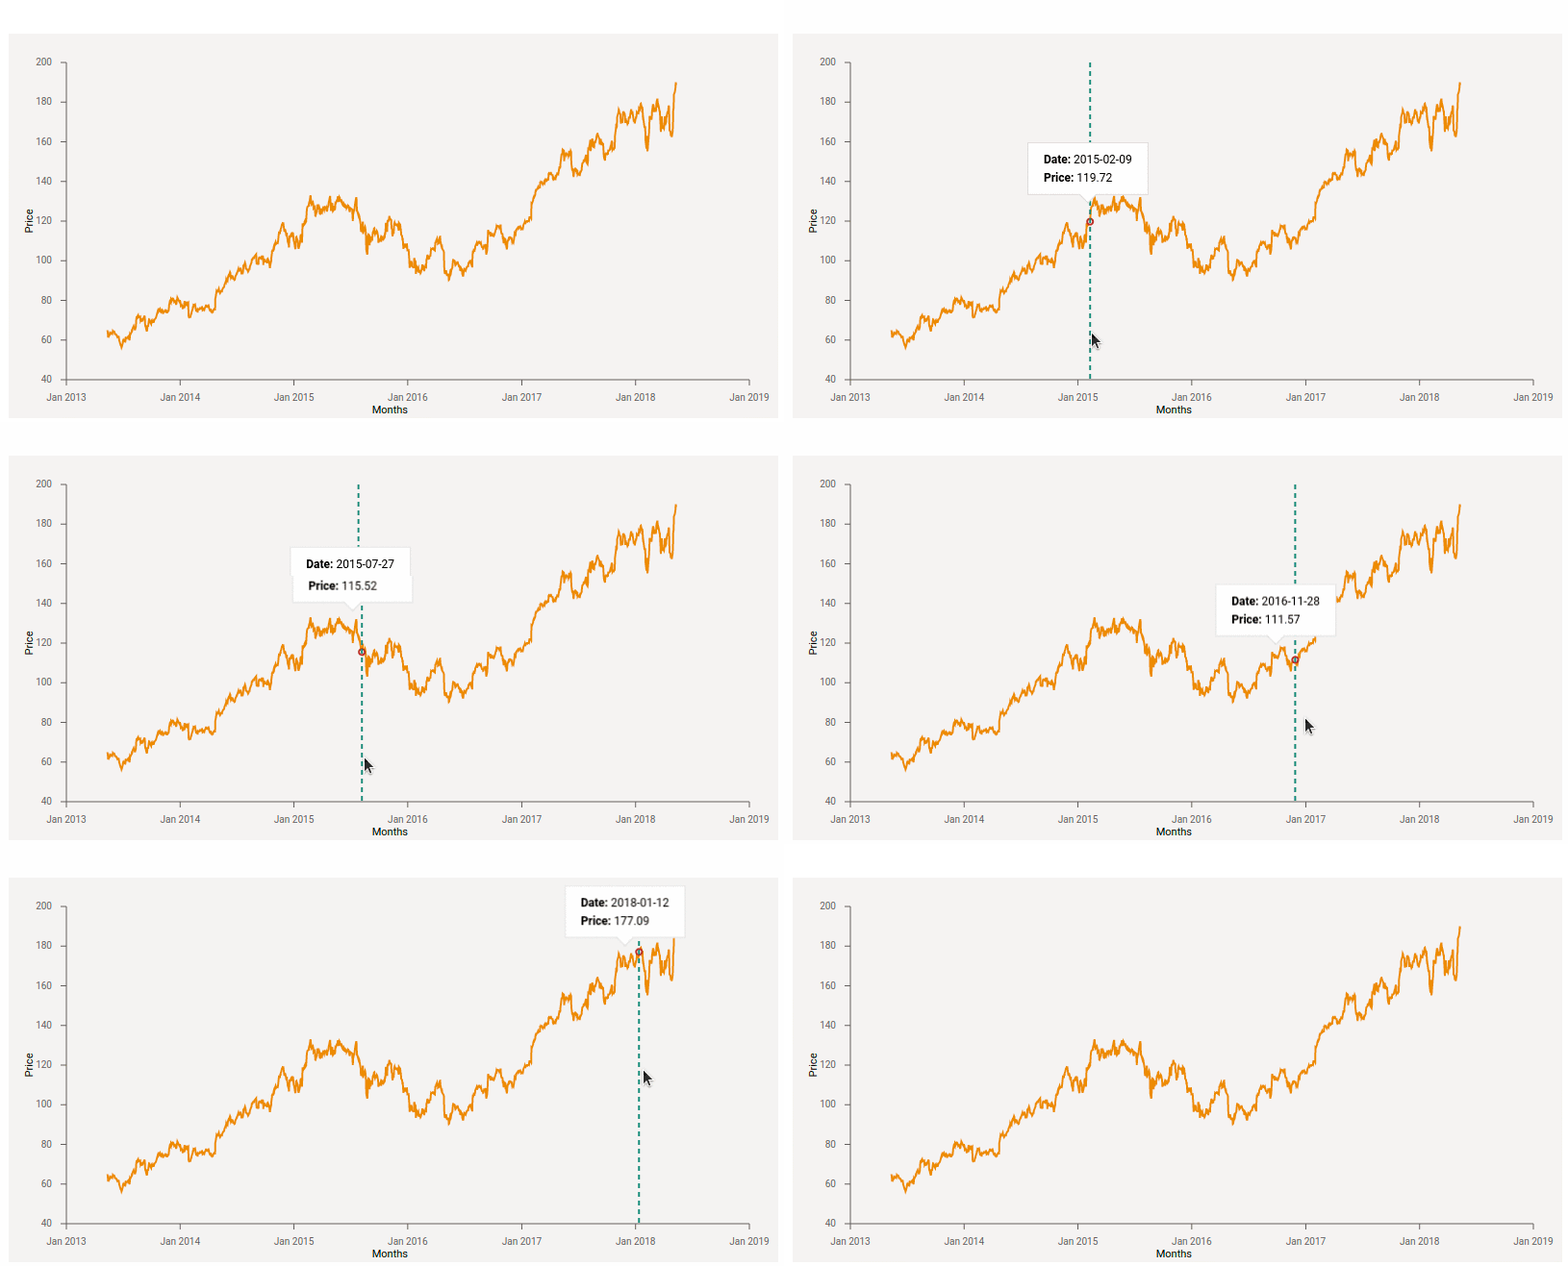
Here's our final tooltip:

In summary, adding a tooltip to a line chart is a great way to make your data visualization more interactive and informative. With the help of React, you can easily create a tooltip that displays additional information when a user hovers over a specific point. You can find the code in this Github repo.
